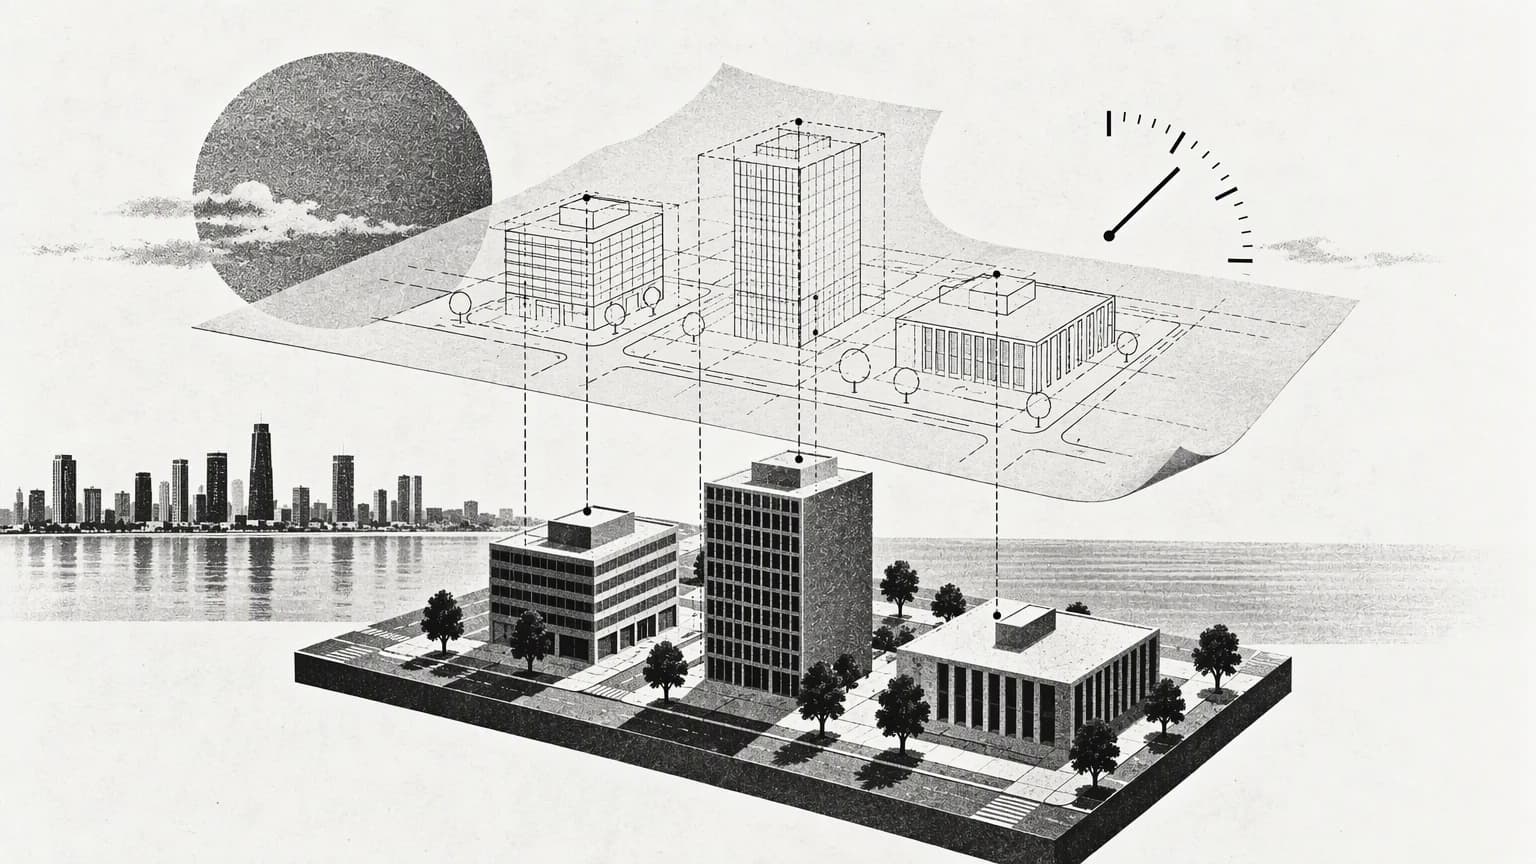
On 12 August 2026, OGC published Technical Paper 26-050 on interoperable geospatial data that is ready for AI use. It is a proposal for discussion, not a formal, binding standard. What stands out to me is the importance of linking structure, meaning and data provenance, because these questions come before any advanced visual presentation of a city or a facility.
The same building in more than one record
Imagine a building that appears on a map, in a permit record and in a site visit report. The systems may use different identifiers, or one may refer to the plot and another to the unit. Before bringing these records together in a single interface, we need to know what each record represents and how to prove that the link between them is correct.
I would distinguish between identifier, location and description. A similar address is not always enough to link records, and a point on a map does not, on its own, explain the scope of the document attached to it. Spelling out these differences makes the integration verifiable and reduces the chance of attributing information to the wrong asset.
Source and time are part of the information
The paper covers documenting a workflow's inputs and outputs and the sequence in which they were produced, while acknowledging that a complete, interconnected operational system lies outside its current scope. In the application I have in mind, the reader should know when a piece of information was captured, who created it, and what transformations it went through before appearing on the map.
This matters when a field observation is shown next to the output of an analytical model. The first records an event under particular conditions; the second is a result that depends on inputs and assumptions. They can sit in the same interface, but their nature, status and date should remain clear to the user.
A small start that can be tested
- Choose a limited set of assets and one question the team wants to answer.
- Standardise the definitions of the fields, identifiers and units of measurement in use.
- Link every value to its source, its date and its review status.
- Test for conflicts, outdated data and unconfirmed links.
The starting point could be a screen showing the latest documented visit for each asset, with a link to the original report. Making even this simple example work means resolving questions of asset identity, permissions and updates. Once those have been verified, thinking about simulation or advanced analysis rests on data that is better understood.
The quality of the information structure is what gives the model its value over time. A 3D scene becomes a working tool when users can understand where what they are seeing comes from, what its limits are, and when it was last updated.